Science · Oceans, weather & climate
How a weather forecast is made
Follow observations into a model and out the other side as a probability, and find out what a 40% chance of rain does and doesn't claim.
What you will learn
- List what gets measured and with which instruments, and say why so many sources are needed
- Explain what an analysis is and why it comes before any prediction
- Describe what forecasters do when the models disagree about an outcome
- Explain what a local forecaster adds to large-scale model output
Lesson 1 of 4 · 5 min
How forecasters build a picture of the sky right now
At the same set times each day, usually twice, people at more than 800 stations around the world release a weather balloon. Each balloon carries a small instrument package up through the air for about two hours. By the time it bursts, it can be 35 kilometers high.
The effort exists because a forecast can't begin with tomorrow. It begins with what the air is doing right now, everywhere at once, and that's hard to find out.
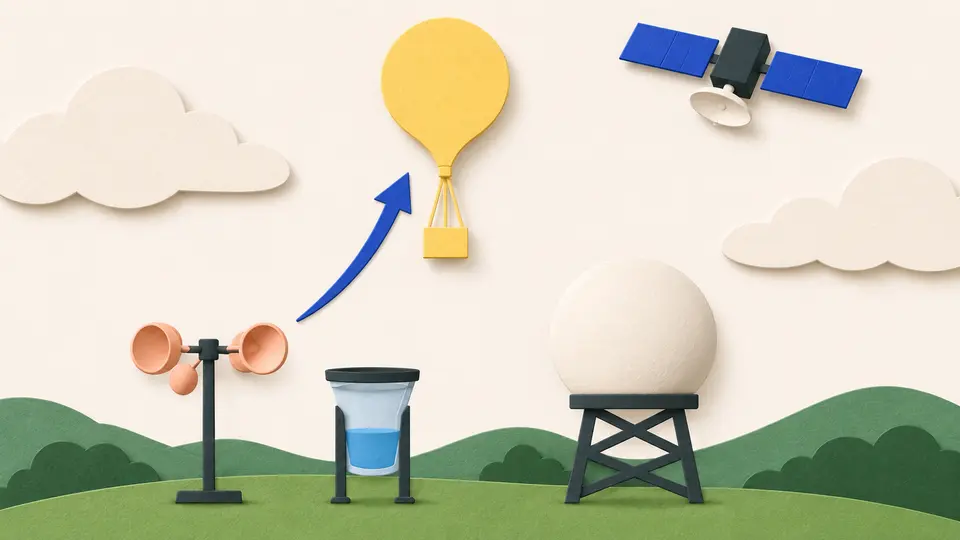
The list of what gets measured is short. It's temperature, humidity, precipitation, air pressure, wind speed and wind direction. Thermometers, rain gauges, barometers and wind meters handle those at ground level. Balloons reach the air above, Doppler radar tracks rain from a distance, and satellites watch from outside.
People still report what instruments miss, such as the kind of cloud and the type and size of what's falling. NOAA counts more than 210 million observations processed in the United States each day, from automated instruments, meteorologists and thousands of trained volunteers.
No single instrument covers the atmosphere. Each is fixed in place, or limited in range, or limited in what it can detect. So the picture has to be pieced together from all of them.
A pile of measurements isn't yet a picture. The readings come from scattered points, at different times, from instruments of different kinds and reliability. A balloon gives one line up through the air. A thermometer gives one spot on the ground.
So the next step is an analysis. Computer programs turn the readings into one consistent map of current conditions that covers the whole area, including the places nobody measured.
A forecast model needs that. It takes the complete state of the atmosphere and calculates how that state will change. A list of readings with gaps gives it nothing to start from.
The same routine serves every kind of forecast, from rain and snowstorms to hurricanes, river levels and ocean waves. Forecasters gather the observations, build the analysis, then work out how it will change.
Try to recallSomeone asks why weather forecasters don't just feed raw instrument readings straight into the computer. Explain what the analysis step is for.
Raw readings don't add up to a state of the atmosphere. They're taken at scattered points and different times, by instruments of different kinds and reliability. The analysis turns them into one consistent picture of current conditions across the whole area.
A model calculates how a state changes, so it has to start from a complete state. A list of readings with gaps isn't one.
Lessons in this topic
How forecasters build a picture of the sky right now
Before predicting anything, forecasters piece together the current state of the atmosphere from millions of separate measurements.
What forecasters do when the models disagree
Models given the same starting picture still disagree. See how forecasters choose between them, and what a local office adds.
Why the forecast gets worse further out
Two separate problems make a forecast less reliable the further ahead it looks. The answer is to run the model many times and see how far the runs spread.
What a 40% chance of rain means
The most quoted number in a forecast is also the most misread. See what it measures, and what it leaves out.
Three quick stories from this topic
What a 40% chance of rain means
A 40% chance of rain doesn't mean rain for 40% of the day or over 40% of the area
It's the chance that one forecast point gets at least 0.01 inches of rain. So the number says nothing about how long or how hard it will rain, and a drizzle too light to measure doesn't count.
It's a probability at a threshold
The figure is the probability that the specific forecast grid point gets at least 0.01 inches of rain. Drizzle that never reaches that amount doesn't count.
So the number alone can't settle a decision
A 40% chance of a passing shower and a 40% chance of a damaging thunderstorm look identical. You have to ask separately about severity and the worst case.
How accurate forecasts are
A 5-day weather forecast is right about 90% of the time, and a 10-day one about half
NOAA puts a seven-day forecast at about 80%. Accuracy falls because nobody can measure the whole atmosphere, and small errors in the starting picture grow with every day the model runs ahead.
Two causes
The National Weather Service names incomplete sampling of the atmosphere and its chaotic nature. Together they make forecasts more uncertain the further ahead they look.
So the model is run 31 times
The US Global Ensemble Forecast System starts 31 runs from slightly different pictures of the atmosphere. How far the runs spread apart shows how much to trust the forecast.
The world's balloon launches
Weather balloons rise from over 800 stations worldwide on a shared daily schedule
Each balloon carries an instrument package weighing 60 to 80 grams. It climbs for about two hours through air as cold as minus 90 degrees Celsius, swells from 1.5 meters across to as much as 8, and can burst more than 35 kilometers up.
Timed together
The launches are usually timed close to 00:00 and 12:00 UTC, 365 days a year, and countries share the data under international agreements.
Why forecasts need them
A forecast starts from a picture of the whole atmosphere right now. Balloons supply the temperature, humidity, pressure and wind of the air above the ground.
Sources
- Weather observations, NOAA Education
- Radiosonde Observation, National Weather Service
- Forecast Process, NOAA National Weather Service
- Global Ensemble Forecast System (GEFS), NOAA National Centers for Environmental Information
- FAQ - What is the Meaning of PoP, NOAA National Weather Service, Atlanta/Peachtree City
- How Reliable Are Weather Forecasts?, NOAA National Environmental Satellite, Data, and Information Service