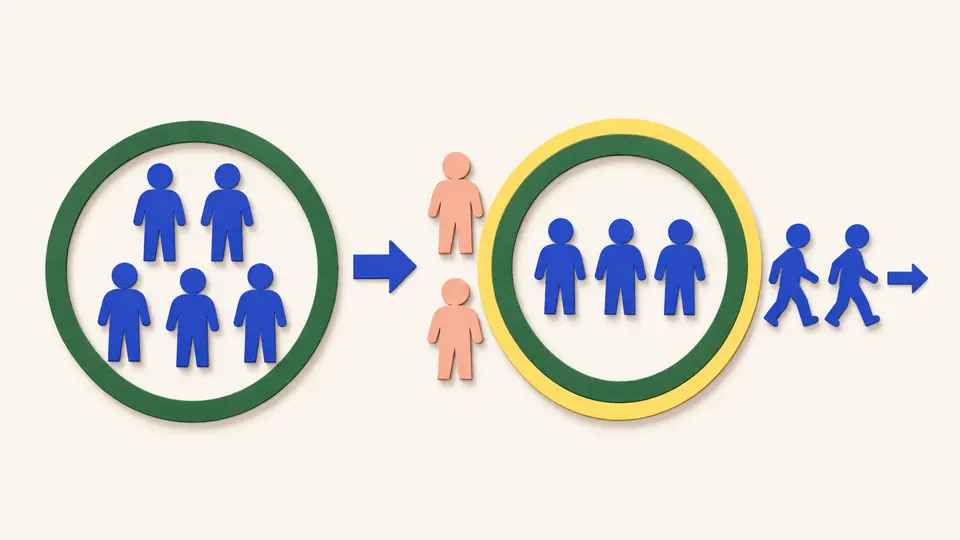
Business & Organizations · Operations & supply chains
When variation signals a real problem
Every process varies from one result to the next. Use a control chart to tell ordinary variation from a real change, and see why adjusting after every result makes a steady process worse.
What you will learn
- Tell common-cause variation apart from special-cause variation
- Describe the two mistakes a manager can make when reading variation
- Describe what the center line and control limits on a control chart show
- Calculate how often a steady process crosses 3-sigma limits by chance
Lesson 1 of 4 · 5 min
Two kinds of variation, and two ways to misread them
In 1918 a physicist named Walter Shewhart joined Western Electric, which made equipment for the Bell telephone system. Quality control there meant inspecting finished products and throwing out the bad ones.
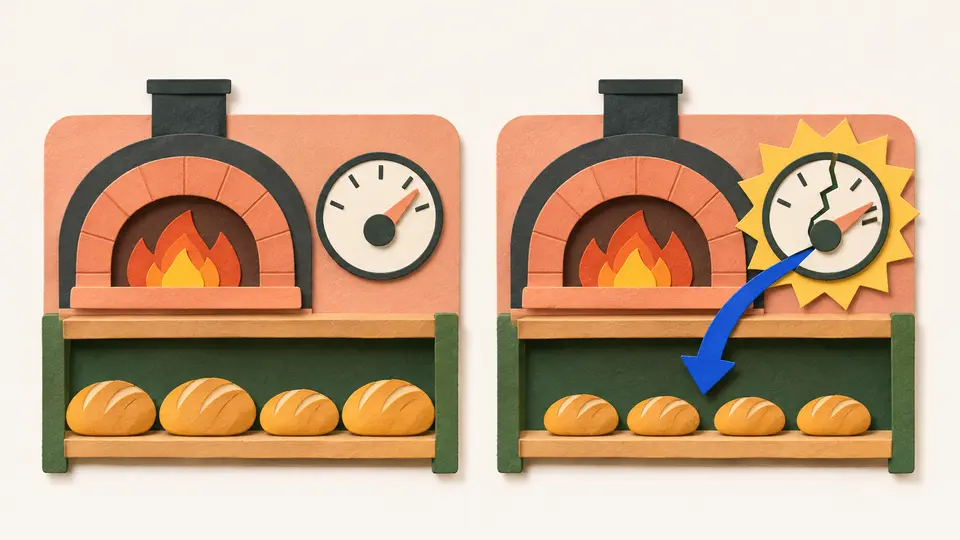
Shewhart saw a problem underneath that. No process turns out identical results. Say a bakery's loaves are meant to weigh 500 grams. Even with the same recipe and oven, some come out a few grams heavy and some a few grams light.
He concluded that variation comes in two kinds. Common-cause variation is built into the process and is always there, like the everyday spread in loaf weights. Special-cause variation comes from something that isn't always present, like a broken oven thermostat.
A process with only common-cause variation is called stable, or in statistical control. Its results follow a consistent pattern, so you can predict them within limits.
A process hit by special causes keeps changing. You can't predict it, and it's hard to improve, because nobody can tell in advance what a change to it will do.
All data carry some random noise, so a manager can misread results in two ways. The first is treating common-cause variation as if it had a special cause. A heavy loaf gets blamed on the baker, and someone resets the oven to fix a wobble the process always produces. This is overadjusting, and each needless adjustment adds variation of its own.
The second mistake runs the other way. A real change gets written off as ordinary variation. If the thermostat broke and every loaf came out light, this mistake would leave the fault in place. Its usual form is never looking for a special cause at all.
The two kinds call for different fixes. A special cause can be tracked down and removed. Common-cause variation belongs to the process itself, so reducing it means finding and removing causes built into the process.
Try to recallA sales manager calls an emergency meeting after one slow week in an otherwise steady record. Another sales manager shrugs off three straight weeks far below anything the team has seen before. Which mistake is each manager making?
The first manager treats common-cause variation as if it had a special cause, and spends effort fixing a wobble the process always produces. The second treats a real change as ordinary variation, so nobody looks for the special cause behind it.
Shewhart's tool for telling the two kinds apart fit on one sheet. On May 16, 1924, he gave his boss a memo about a page long. A third of the page was a simple diagram, the first control chart.
The chart draws the limits of a process's ordinary variation, so a result outside them stands out. A century later it's still one of the seven basic tools of quality control.
Lessons in this topic
Two kinds of variation, and two ways to misread them
Every process wobbles. Tell the wobble that's built in from a change with a cause you can find, and see the two mistakes a manager can make.
How to read a control chart
Read the lines on a control chart, and work out how often a process that hasn't changed will still set off an alarm.
Where control limits come from
Work out control limits from a handful of samples, and see why a chart can signal trouble while every point stays inside them.
Why correcting every miss makes things worse
Follow Deming's funnel experiment to see how correcting a steady process after every result makes it worse, and what it takes to improve one.
Three quick stories from this topic
A one-page memo
The control chart, one of quality control's seven basic tools, began as a one-page memo
Walter Shewhart wrote it at Western Electric on May 16, 1924. His boss recalled that a third of the page was a simple diagram. Until then, industrial quality meant inspecting finished products and removing the defective ones.
What it was for
Shewhart introduced the chart to tell two kinds of variation apart. One is natural to a process. The other comes from causes that are present only some of the time.
What came before
When Shewhart joined Western Electric in 1918, industrial quality was limited to inspecting finished products and removing the defective ones.
False alarms by design
With bell-curve data, a steady process still trips its alarm about once in 370 points
Each point on a control chart has a 0.0027 chance of landing outside the usual 3-sigma limits by luck alone. A plant that charts one sample an hour should expect about two false alarms a month.
An arbitrary line
With normal data, 3-sigma limits approximate a standard of two false alarms in a thousand. NIST's statistics handbook calls that figure a purely arbitrary number. It could be one in a hundred, depending on how much risk management will accept.
Skewed data
The 0.0027 figure assumes normal data. In NIST's example of skewed counts averaging 0.8, the chance of a false alarm above the upper 3-sigma limit is 0.009.
Deming's funnel
In Deming's funnel experiment, correcting the aim after every miss made the scatter wider
Over 15 marble drops, a funnel left alone landed within 5 of the target. A funnel moved after each drop to cancel the last miss ranged from 10 below to 7 above. Each correction chased a chance error that was already over.
Why it happens
Each correction reacts to a chance error, and the next drop brings a fresh chance error on top of the move. Deming called this kind of change tampering.
Worse rules
Setting the funnel opposite each miss, measured from the target, made the system explode, with results from 14 below to 16 above. Setting it over the last drop sent the system further and further off target.
Sources
- Walter A. Shewhart, Wikipedia
- Control chart, Wikipedia
- Deming's funnel experiment, Yonatan Reshef, University of Alberta School of Business
- 6.3.1. What are Control Charts?, National Institute of Standards and Technology
- Understanding variance, Yonatan Reshef, University of Alberta Faculty of Business