Business & Organizations · Customers & marketing
What customer research can and cannot tell you
Pick research that fits the decision, see why a poll with 2.4 million replies called an election wrong, and tell a rise that follows a change from a rise the change caused.

What you will learn
- Tell primary research apart from secondary research.
- Choose a method that fits an exploratory question or a measurement question.
- Identify a sampling problem in a survey of existing customers.
- Recognize wording that steers a response.
Lesson 1 of 4 · 4 min
Pick the research that fits the decision
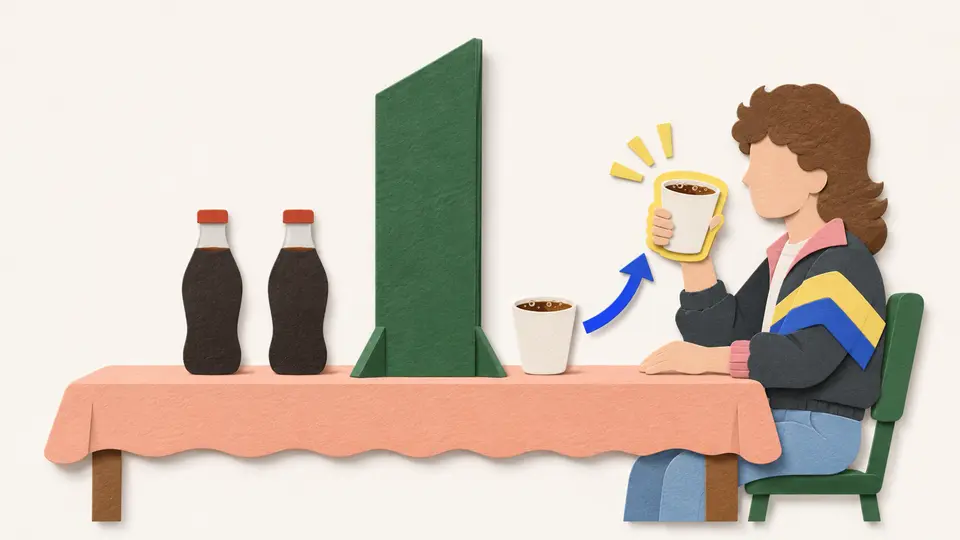
In 1985 Coca-Cola had taste tests from nearly 200,000 people, and they preferred a new formula. The company swapped it in for the original. Drinkers protested by the thousands, and 79 days later the old formula was back.
The research was huge, and it answered the wrong question. The tests asked which drink tasted better. The decision was whether to take the original away.
So start with the decision and what you don't know about it. Say a museum wants more people at its evening events. "We need research" is too broad to act on. "We don't know why nearby residents skip Thursday evenings" tells you who to ask and what about.
The museum can use two kinds of data, sorted by why they were collected. Primary data is gathered for the question at hand, through new interviews or a new survey. Secondary data was collected earlier for some other purpose, like census figures or the museum's past ticket records.
Secondary data is usually cheap and quick to get. Its weakness is that nobody collected it with your question in mind, so it may not hold the answer. Primary data can be built to fit, but it costs more and takes longer.
Interviews let you dig into a few people's experiences. One resident might say the last bus leaves before the event ends. Another might assume the museum closes at five. You couldn't have put either answer on a survey form, because you didn't know to ask.
What interviews can't give you is a percentage. Ten conversations might turn up five different barriers. They can't tell you how many residents face each one. Finding the reasons and counting them are different jobs.
Counting is the job of a survey. It asks many people the same questions, so it can estimate how common each answer is. That only works if the right people are asked and the questions are fair.
The museum's ticket records have a blind spot. They show every purchase and nothing about the people who thought about coming and stayed home. Those are the people the museum wants to understand. So ask of any evidence whose behavior is missing from it.
Try to recallA museum wants to discover why residents avoid its evening events and then estimate what share of residents face each barrier. Which method fits each aim, and why can't the first method answer the second question?
Interviews fit the exploratory aim because they look at selected people's experiences in depth. A survey of a suitably sampled population fits the estimate. A few interviews with selected people can't establish proportions for the whole population.
Lessons in this topic
Pick the research that fits the decision
See why Coca-Cola's 200,000 taste tests answered the wrong question, and match interviews, surveys and existing records to what each one can tell you.
Why 2.4 million answers got an election wrong
A 1936 poll with 2.4 million replies picked the losing candidate. See how who gets asked, who replies and how a question is worded decide what a percentage means.
Did the change cause the result?
Ticket sales rose after a new poster. See why that proves little, and how a test that splits people by chance shows what a change really did.
How a small sample can speak for a whole town
Tell a probability sample from a convenience sample, use stratified sampling so a small group is heard, and check how many of the people picked replied.
Three quick stories from this topic
The Bing headline test
A Bing headline idea waited over six months for a test, then lifted revenue by 12%
Managers had ranked the 2012 idea a low priority. An engineer finally showed the new ad headlines to some users and the old ones to others. The gain was worth more than $100 million a year in the United States alone.
Why it took a test
Revenue moves every day for many reasons. Showing both versions over the same hours meant the headline was the one thing that differed between the two groups of users.
After is not because
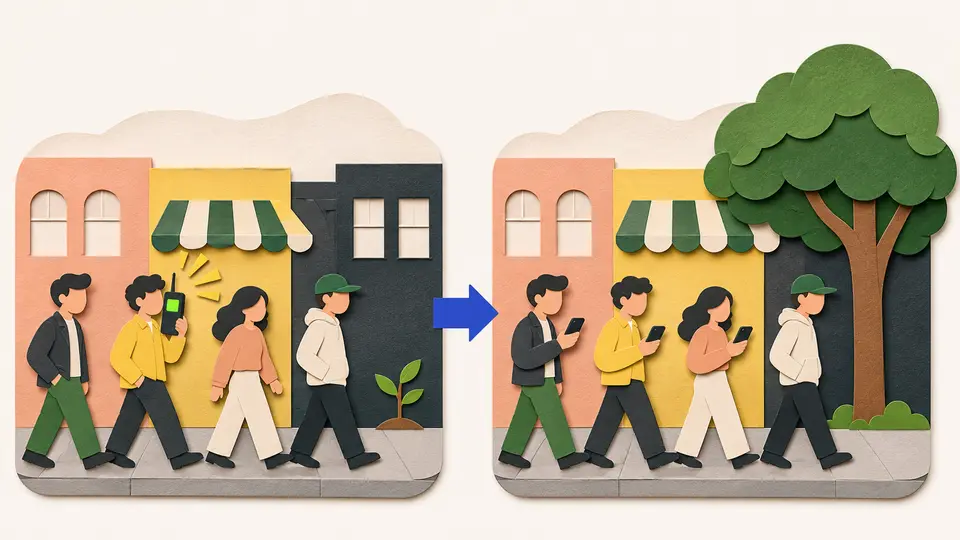
Sales that rise after a change might have risen anyway. A same-time comparison shows what the change itself added.
The census knocks on doors
The 2020 US census planned visits to about 56 million addresses that had not replied
By July 2020, 61.8% of households had answered on their own. A survey can live with that and report on whoever replied. A census has to count everyone, so census takers were sent to every address that stayed silent.
Why research uses samples
Reaching everyone in a population is slow and expensive. Most research asks a small part of it and chooses that part carefully.
Silence is information
The people who don't reply may differ from the ones who do. A census chases them. A survey has to report how many it never heard from.
The 1936 Literary Digest poll
A 1936 poll with 2.4 million replies picked the loser of a 46-state landslide
The Literary Digest mailed 10 million ballots, mostly to names from telephone books and car registrations, and three in four went unanswered. It forecast a win for Alfred Landon. Franklin Roosevelt carried every state but Maine and Vermont.
Big is not representative
A sample speaks for a population only if its members were chosen to stand in for it. Millions of replies from the wrong mix of people repeat the same tilt millions of times.
Two flaws at once
The mailing list left out many voters, and only 24% of the people on it replied. Researchers still debate which flaw did more damage.
Sources
- 6.3 Steps in a Successful Marketing Research Plan - Principles of Marketing | OpenStax, OpenStax, Rice University
- 6.1 Marketing Research and Big Data - Principles of Marketing | OpenStax, OpenStax, Rice University
- Plan your business - Small Business Administration, US Small Business Administration
- New Coke: The Most Memorable Marketing Blunder Ever?, The Coca-Cola Company
- The Surprising Power of Online Experiments, Ron Kohavi and Stefan Thomke, Harvard Business Review, September-October 2017
- A/B testing, Wikimedia Foundation
- 2020 Census: Nonresponse Followup, US Census Bureau
- Roosevelt Predicted to Win: Revisiting the 1936 Literary Digest Poll (Statistics, Politics and Policy 8(1), 2017, DOI 10.1515/spp-2016-0006), Sharon L. Lohr and J. Michael Brick, De Gruyter
- 1936 United States presidential election, Wikimedia Foundation