Geography & the World · People & migration
Fertility rates and the demographic transition
The total fertility rate is one of the most quoted numbers in the world and one of the most misread. See what it measures, what replacement means, and how falling deaths and then falling births reshape a population.
What you will learn
- State what the total fertility rate measures and why it's a synthetic figure
- Work out what the tempo effect does to a period rate
- Define replacement fertility and say what the threshold depends on
- Tell the total fertility rate apart from the net reproduction rate and the cohort rate
Lesson 1 of 4 · 6 min
The fertility rate describes a woman who never lived
In 2023, South Korea's total fertility rate was 0.72, the lowest of any country that year. Niger's was above 6. It sounds like a count of the children women in each country have. It isn't a count of anyone's children.
The rate is the number of children a woman would have if she lived her whole reproductive life at the birth rates of one single year. At 20 she'd have the birth rate of this year's 20-year-olds. At 40 she'd have the rate of this year's 40-year-olds.
The usual calculation works like this. Take each five-year age group, from 15 to 19 up to 45 to 49. Divide the year's births to women in the group by the number of women in it. Add the seven rates and multiply by five, because each group spans five years of age.
That makes the rate synthetic. Every part of the sum comes from a different set of women in the same year. The 20-year-olds who supply one rate aren't the 40-year-olds who supply another, and nobody knows what today's 20-year-olds will do at 40. It's a snapshot of one year, written as if it were a lifetime.
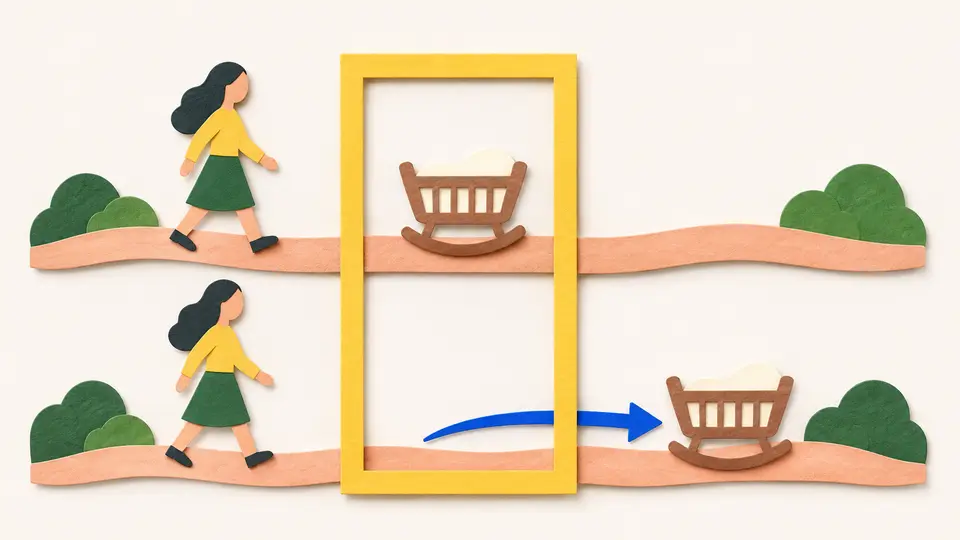
Because the rate comes from a single year, anything that shifts births in time distorts it. Demographers call this the tempo effect. If women start having children later but end up with just as many, the rate still falls for a while, because the births are happening later.
Say women who once had a first child at 26 now have it at 31. During the shift, births that would have come to women in their twenties haven't happened yet, and births to women in their thirties haven't caught up. The one-year snapshot records a gap that those women's lifetimes may never contain.
East Germany shows it. In 1994 its rate fell to 0.80, the lowest ever recorded outside Asia. Women there were moving to later motherhood. Older women already had their children and younger women were putting theirs off, so few births fell in those years. The number of children each generation ended up with dropped much less.
So when a fertility rate drops sharply in a few years, ask whether people are having fewer children or having them later. The long-run results are very different.
Try to recallA country's total fertility rate fell sharply over a decade in which the average age at first birth rose by several years. What can't you conclude from that, and why?
You can't conclude that women there will end up with fewer children over their lifetimes. The rate is built from one year's births, so it's subject to the tempo effect. If women have children later but just as many, the rate falls anyway while the shift is under way, because births are postponed out of the years being measured.
To know whether families are really smaller, you need the cohort rate, the number of children a generation actually had. That's only known once the generation has finished having children.
So read a fertility rate as a statement about one year. South Korea's 0.72 says that if 2023's birth rates lasted a woman's whole life, she'd have fewer than one child on average. It doesn't say how many children Korean women will end up having. That number takes decades to arrive.
Lessons in this topic
The fertility rate describes a woman who never lived
The total fertility rate takes one year of a country's births and stretches it across a whole lifetime. See how it's built, and how later births can pass for fewer births.
Why replacement fertility isn't always 2.1
The replacement figure everyone quotes belongs to wealthy countries where few children die. Elsewhere it has been as high as 3.5.
How falling death rates set off a population boom
The shift from high birth and death rates to low ones is drawn as four stages. The boom happens in the gap, after deaths fall and before births follow.
What the demographic transition model can't tell you
Fertility falls as countries develop, almost everywhere. Why it falls, and how fast, is still argued over.
Three quick stories from this topic
Why replacement isn't 2.1 everywhere
Replacing a generation takes 2.1 births per woman, or up to 3.5 where many children die
A birth counts toward replacement only if the child lives to have children. So where child mortality is high, more births are needed and the threshold rises. Both figures are from 2003. The world average for 2010 to 2015 was 2.3.
The net reproduction rate counts daughters
It's the number of daughters per woman under the current fertility and mortality rates, and exactly 1 means each generation of women precisely replaces itself. It matters most where sex selection is common.
The cohort rate gives the real answer, but late
It's the number of children actually born on average to one age cohort, which can only be measured at the end of the reproductive stage, typically around age 45. That makes it a lagging indicator.
What the fertility rate measures
The total fertility rate describes a woman who never existed
It's the number of children a woman would have if she spent every year of her reproductive life at this year's birth rates, age by age. Nobody lives that life. South Korea's rate of 0.72 in 2023, the lowest of any country that year, was built that way.
It's built from five-year age groups
For one year, add up the birth rates of each five-year age band and multiply by five. Single-year bands would be more accurate, but the data may be unavailable or poorly estimated.
Later births look like fewer births
This is the tempo effect. If women have children later but have the same number over their lives, the period rate still drops. The Czech Republic and Spain in the 1990s are the standard examples.
Seven children, a third lost
In 1800 the US fertility rate was 7.0, and a third of children died before turning five
A rate of 7.0 means about seven children per woman. By 1900, child mortality was 23% and the rate 3.9. By 2018 they were 0.6% and 1.9. Across the world, death rates fell first and birth rates followed later. Populations boomed in the gap between the two.
The boom comes from survival
When death rates fall and birth rates stay high, a population grows fast. Families aren't having more babies than before. More of their children live.
Clean water did more than medicine
Death rates first fell through better food supplies, water, sewers and hygiene. Europe passed through this stage before the medical advances of the mid-1900s.
Sources
- Total fertility rate, Wikimedia Foundation
- Demographic transition, Wikimedia Foundation